DuckDB Inside Postgres: The Unlikely Duo Supercharging Analytics
If you work in data engineering, you know that the field moves at a dizzying pace. New tools and technologies seem to pop up daily, each promising to revolutionize how we store, process, and analyze data. Amidst this constant change, two names have remained stalwarts: Postgres, the tried-and-true relational database, and DuckDB, the talented new kid on the block for analytics workloads.
But what if I told you that these two data powerhouses could work together - not just side by side, but DuckDB inside Postgres? Sounds wild, right? Let’s explore what this dynamic duo can do.
Why DuckDB and Postgres Are a Match Made in Data Heaven
Postgres has long been a go-to for data storage. It’s reliable, feature-rich, and ubiquitous across data platforms. But when it comes to analytics on large datasets, especially those requiring complex aggregations, Postgres can start to strain under the load.
Enter DuckDB. This embedded analytical database engine shines where Postgres struggles. DuckDB was built from the ground up to excel at OLAP (online analytical processing) workloads. It’s lightning-fast, thanks to its columnar storage and vectorized query execution.
Marrying Postgres’ robust data management with DuckDB’s analytics prowess is a stroke of genius. It’s like having a dependable workhorse that can suddenly sprout wings and soar when it needs to crunch some serious numbers.
Putting DuckDB Inside Postgres to the Test
Of course, the proof is in the pudding (or the query execution time, as it were). Using a handy Docker image provided by the DuckDB team, I spun up a Postgres instance with the DuckDB extension installed. I then generated a hefty dataset - 100 million records - and loaded it into a Postgres table. A complete guide on how to do it can be found below.
Testing DuckDB Inside Postgres: A Step-by-Step Guide
Curious to see DuckDB inside Postgres in action? Here’s how you can run your own tests:
Spin up a Postgres-DuckDB Docker container:
1docker run -d -e POSTGRES_PASSWORD=duckdb pgduckdb/pgduckdb:16-mainGenerate a test dataset. I used a custom Rust tool that I made to generate a 100 million record CSV 16GB in size, but you can use your preferred method. Ensure your CSV matches this schema:
 1
 2
 3
 4
 5
 6
 7
 8
 9
10
11
12
13
14
15
16
17
18
19
20
21
22
23
24
25
26
27
28
29
{ "columns": [ { "name": "id", "type": "integer", "description": "The unique identifier for the transaction." }, { "name": "user_id", "type": "integer", "description": "The identifier of the user associated with the transaction." }, { "name": "provider_id", "type": "integer", "description": "The identifier of the provider associated with the transaction." }, { "name": "amount", "type": "float", "description": "The amount of the transaction." }, { "name": "timestamp", "type": "string", "description": "The timestamp indicating when the transaction occurred." } ] }Load the data into Postgres:
- Copy the CSV into the Docker container:
- Connect to Postgres:
1docker exec -it 4222c43adc85 psql - Create a table matching your schema:
1 2 3 4 5 6 7 8 9 10 11 12 13 14 15 16 17 18 19CREATE TABLE transactions ( id UUID PRIMARY KEY, user_id UUID NOT NULL, provider_id UUID NOT NULL, amount DOUBLE PRECISION NOT NULL, timestamp VARCHAR(255) NOT NULL ); // To check if table is created run \dt and you should see something like this postgres=# \dt List of relations Schema | Name | Type | Owner --------+--------------+-------+---------- public | transactions | table | postgres (1 row) - Import the CSV data:
1COPY data FROM '/tmp/your_data.csv' DELIMITER ',' CSV HEADER;
Run a test query using plain Postgres:
    Finalize GroupAggregate  (cost=2374452.53..2379719.52 rows=20000 width=48) (actual time=12746.024..12760.932 rows=20
 000 loops=1)
    Group Key: user_id, provider_id
    ->  Gather Merge  (cost=2374452.53..2379119.52 rows=40000 width=48) (actual time=12745.973..12757.082 rows=60000 l
 oops=1)
          Workers Planned: 2
          Workers Launched: 2
          ->  Sort  (cost=2373452.51..2373502.51 rows=20000 width=48) (actual time=12693.440..12694.115 rows=20000 loo
 ps=3)
                Sort Key: user_id, provider_id
                Sort Method: quicksort  Memory: 2175kB
                Worker 0:  Sort Method: quicksort  Memory: 2175kB
                Worker 1:  Sort Method: quicksort  Memory: 2175kB
                ->  Partial HashAggregate  (cost=2371823.74..2372023.74 rows=20000 width=48) (actual time=12687.513..12689.023 rows=20000 loops=3)
                      Group Key: user_id, provider_id
                      Batches: 1  Memory Usage: 3089kB
                      Worker 0:  Batches: 1  Memory Usage: 3089kB
                      Worker 1:  Batches: 1  Memory Usage: 3089kB
                      ->  Parallel Seq Scan on transactionsv2  (cost=0.00..1955151.87 rows=41667187 width=40) (actual time=0.687..7396.973 rows=33333333 loops=3)
  Planning Time: 3.365 ms
  JIT:
    Functions: 24
    Options: Inlining true, Optimization true, Expressions true, Deforming true
    Timing: Generation 6.757 ms, Inlining 139.663 ms, Optimization 76.226 ms, Emission 67.729 ms, Total 290.374 ms
  Execution Time: 12769.469 ms
 (22 rows)
Here is the summary of the key execution metrics from this PostgreSQL query plan:
Total Records Scanned:
- Approximately 100 million records (33,333,333 rows × 3 loops in Parallel Seq Scan)
Timing Breakdown:
- Planning Time: 3.365 ms
- JIT Compilation Time: 290.374 ms
- Total Execution Time: 12,769.469 ms (≈12.77 seconds)
The query involved parallel processing with 2 workers and performed aggregation operations, ultimately returning 20,000 rows as the final result.
Run the same query using DuckDB inside Postgres:
Compare DuckDB’s execution time to Postgres.
 Custom Scan (DuckDBScan)  (cost=0.00..0.00 rows=0 width=0) (actual time=16092.034..16092.280 rows=1 loops=1)
DuckDB Execution Plan:

  ┌─────────────────────────────────────┐
  │┌───────────────────────────────────┐│
  ││    Query Profiling Information    ││
  │└───────────────────────────────────┘│
  └─────────────────────────────────────┘
  EXPLAIN ANALYZE SELECT user_id, count(*) AS user_count, sum(amount) AS total_sum FROM pgduckdb.public.transactionsv2 GROUP BY user_id, provider_id
  ┌────────────────────────────────────────────────┐
  │┌──────────────────────────────────────────────┐│
  ││              Total Time: 15.12s              ││
  │└──────────────────────────────────────────────┘│
  └────────────────────────────────────────────────┘
  ┌───────────────────────────┐
  │           QUERY           │
  └─────────────┬─────────────┘
  ┌─────────────┴─────────────┐
  │      EXPLAIN_ANALYZE      │
  │    ────────────────────   │
  │           0 Rows          │
  │          (0.00s)          │
  └─────────────┬─────────────┘
  ┌─────────────┴─────────────┐
  │         PROJECTION        │
  │    ────────────────────   │
  │          user_id          │
  │         user_count        │
  │         total_sum         │
  │                           │
  │         20000 Rows        │
  │          (0.00s)          │
  └─────────────┬─────────────┘
  ┌─────────────┴─────────────┐
  │       HASH_GROUP_BY       │
  │    ────────────────────   │
  │          Groups:          │
  │             #0            │
  │             #1            │
  │                           │
  │        Aggregates:        │
  │        count_star()       │
  │          sum(#2)          │
  │                           │
  │         20000 Rows        │
  │          (2.09s)          │
  └─────────────┬─────────────┘
  ┌─────────────┴─────────────┐
  │         PROJECTION        │
  │    ────────────────────   │
  │          user_id          │
  │        provider_id        │
  │           amount          │
  │                           │
  │       100000000 Rows      │
  │          (0.03s)          │
  └─────────────┬─────────────┘
  ┌─────────────┴─────────────┐
  │         TABLE_SCAN        │
  │    ────────────────────   │
  │         Function:         │
  │     POSTGRES_SEQ_SCAN     │
  │                           │
  │        Projections:       │
  │          user_id          │
  │        provider_id        │
  │           amount          │
  │                           │
  │       100000000 Rows      │
  │          (12.95s)         │
  └───────────────────────────┘


  Planning Time: 3.612 ms
  JIT:
    Functions: 1
    Options: Inlining true, Optimization true, Expressions true, Deforming true
    Timing: Generation 2.988 ms, Inlining 0.000 ms, Optimization 0.000 ms, Emission 0.000 ms, Total 2.988 ms
  Execution Time: 16098.163 ms
Wait wait wait something is wrong?
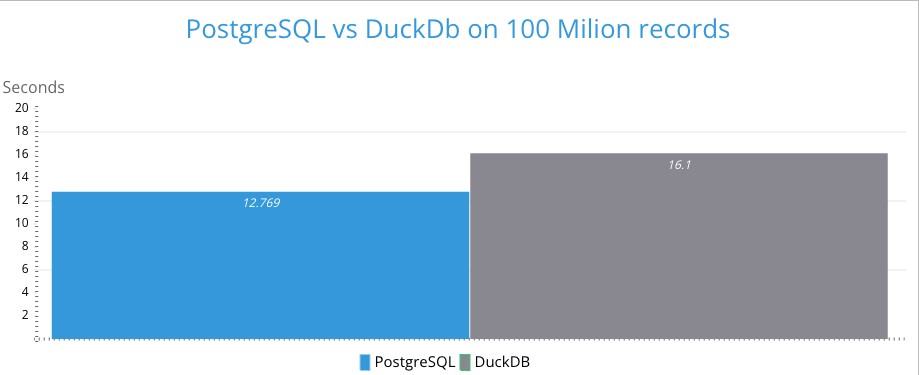
It seems like DuckDB is slower 4 seconds. This is really weird. 😱
Ok so let’s see what’s the problem.
In their latest post here on this link we can read one thing in particular.
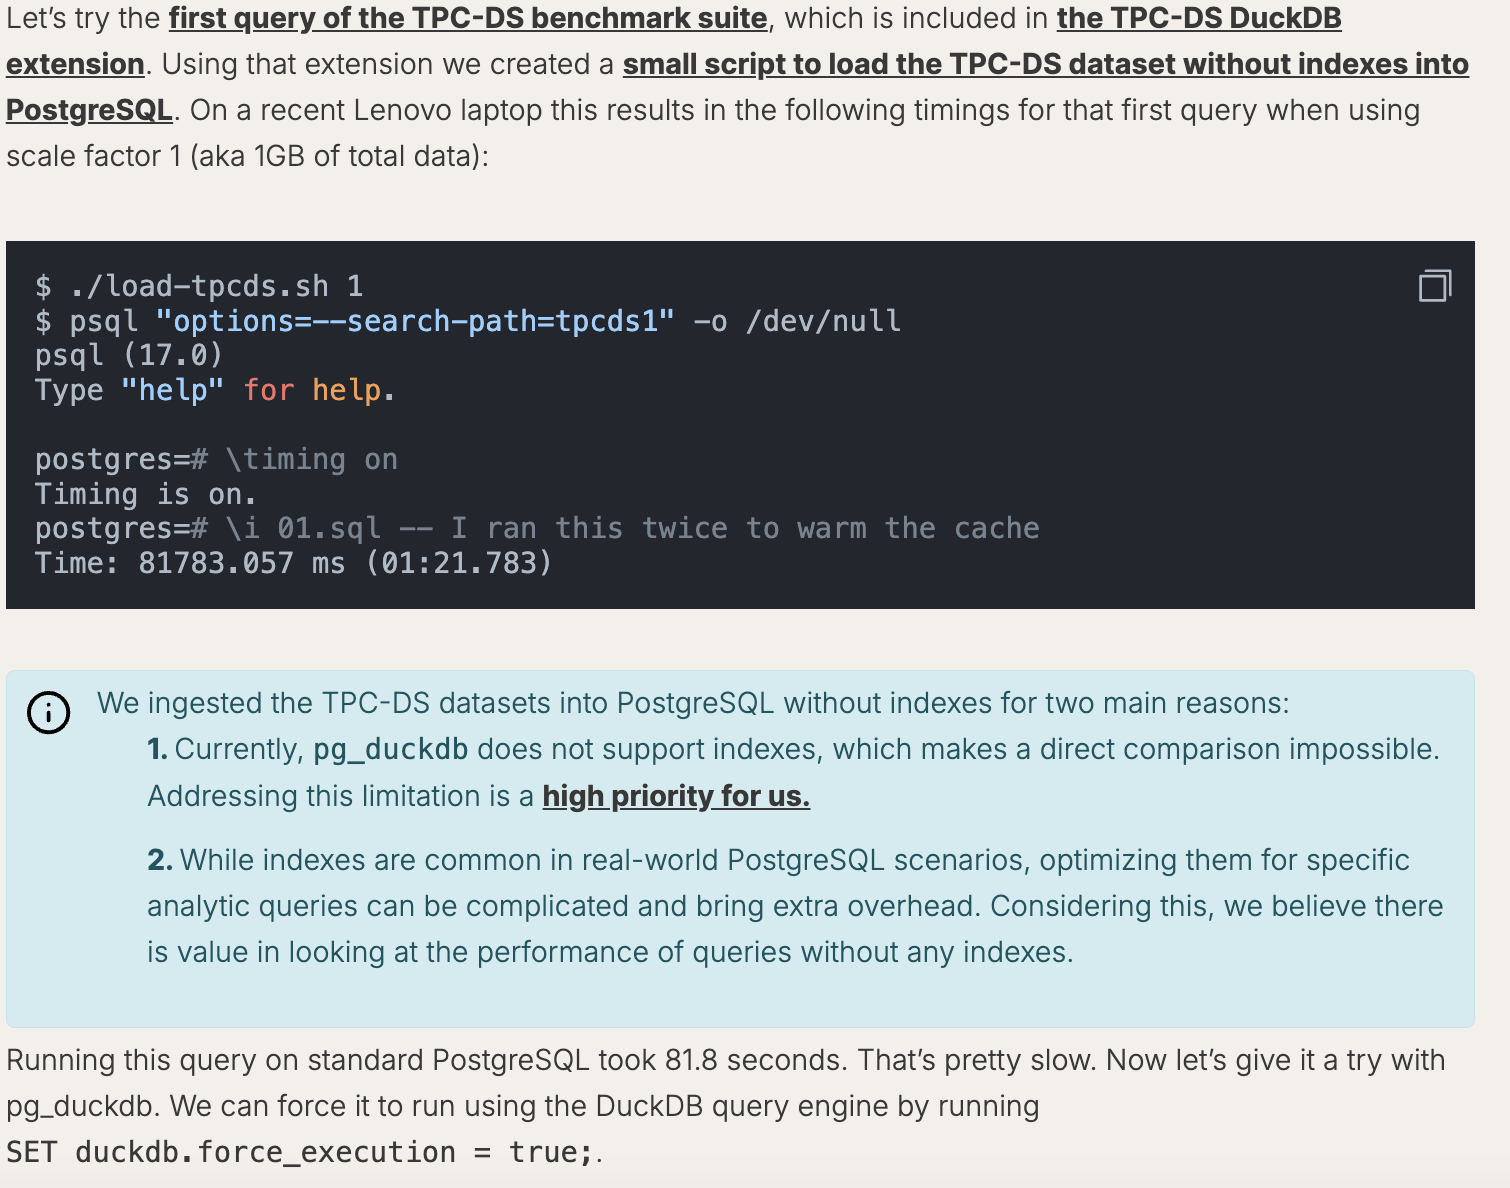
So, from the picture one thing is clear, DuckDB does not support indexes, which is why we have situations where query with DuckDB is slower.
Motherduck performance statement for this duo
Running our analytical query in standard PostgreSQL was painfully slow, taking 81.8 seconds to complete. The same query with DuckDB was executed in 52.190 milliseconds. That is 1500x faster.
If you take this test to another level they say this:
If we run this on EC2 in AWS1, using 10x the data (TPC-DS scale factor 10 instead of 1), this query takes more than 2 hours with the native PostgreSQL execution engine, while it only takes ~400ms when using pg_duckdb.
So the difference is huge 2h VS 400ms imagine that 🤯 🤯 🤯
Other cool features of this magic duo
DuckDB isn’t just about blazing-fast query performance – it’s a Swiss Army knife for modern data workflows. When working with DuckDB inside PostgreSQL, you get access to a powerful suite of features that can transform your data operations. Imagine seamlessly reading and writing Parquet and CSV files directly from cloud storage like AWS S3, Cloudflare R2, or Google GCS with simple SQL commands. You can query massive datasets using file globs, join cloud data with local PostgreSQL tables, and even write your results back to object storage in a single query.
Here are some features you can start using today:
📊 Cloud Storage Integration
- Direct read/write to S3, GCS, and R2
- Support for Parquet and CSV files
- File glob pattern matching for bulk operations
🔄 Data Operations
- Join cloud data with PostgreSQL tables
- Create columnar temporary tables for speed
- Cache remote objects locally for faster queries
- Write query results directly to cloud storage
🛠️ Extensions & Integration
- Apache Iceberg support
- MotherDuck integration
- Easy extension installation with
duckdb.install_extension()
⚡ Performance Controls
- Toggle DuckDB execution on/off with
SET duckdb.force_execution - Create high-performance temp tables using
CREATE TEMP TABLE ... USING duckdb - Smart local caching for remote data
All these powerful features can be toggled on and off with simple commands, giving you complete control over your data workflow.
The Verdict on DuckDB Inside Postgres
DuckDB inside Postgres is a powerful combination that brings together the best of both worlds: Postgres’ reliability and DuckDB’s lightning-fast analytics. While our initial tests showed some performance challenges, the potential of this dynamic duo is undeniable.
So, is the DuckDB-Postgres combination worth the hype? It’s a solid “maybe” for now. While DuckDB didn’t outpace Postgres in this test, I suspect there’s more to the story. The performance boost likely depends heavily on the specifics of your data and queries i.e. if you don’t use indexes it’s 1500 times faster.
Don’t write off this dynamic duo just yet. As the DuckDB team continues to refine their Postgres integration, we may see some truly impressive speed-ups for certain analytics workloads.
In the meantime, it’s exciting to see two data leaders joining forces in new and unexpected ways. Who knows what other surprising pairings the future of data engineering holds?