🎯 Intro
Point an agent at a catalog with 400 tables and ask it a simple question. It reads schemas. Then samples rows. Then guesses at a join. Fourteen tool calls later it hands you a number that’s off by 12%, and you have no idea which step went wrong.
Now hand the same agent three sentences: what a customer is, which table is the trusted one, and how the company counts “active.” One query. Correct answer.
Nothing changed about the model. The context got distilled. And we reduced the tree of noise.
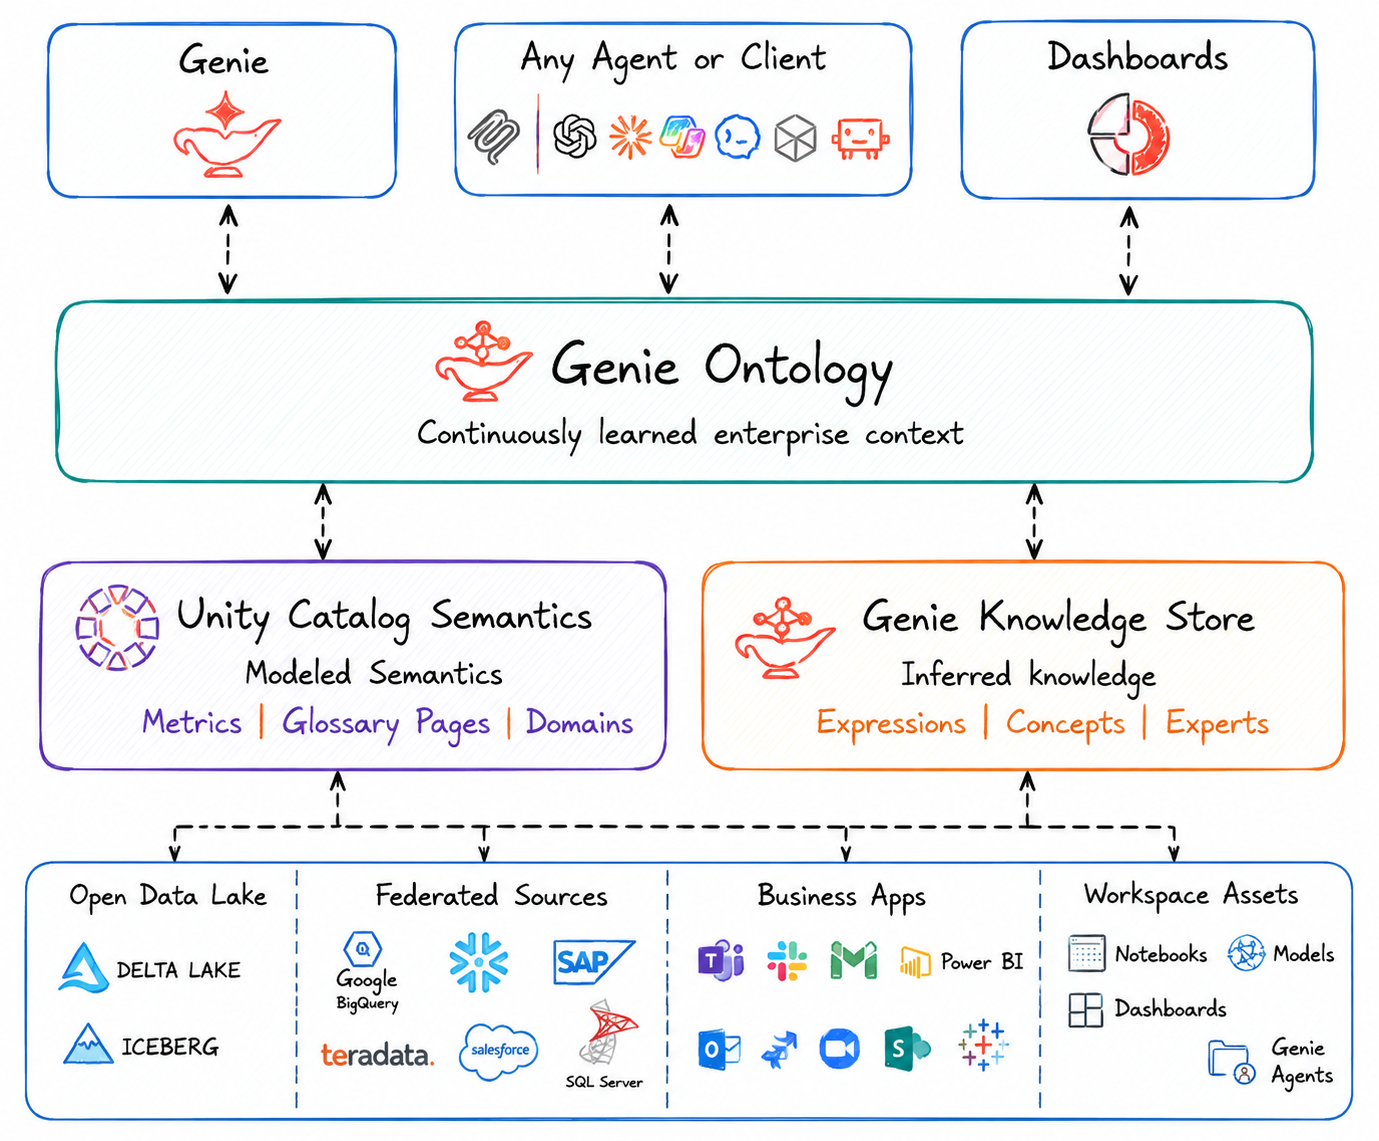
That idea, distillation, is the whole point of Genie Ontology, which Databricks announced in June 2026. It is a living context graph of your business that agents traverse instead of scan.
This post covers what the graph actually is, how the summaries attached to each node do the real work, and one small e-commerce example you can follow end to end.
🧩 What an ontology actually is (in plain words)
Strip away the academic baggage and an ontology is three things: the nouns your business cares about, how they connect, and the rules they obey. For an online store the nouns are Customer, Order, Product, Return, Refund. The connections are the obvious ones: a Customer places Orders, an Order contains Products, a Return points back at an Order. The rules are the part people forget: a refund cannot exceed the order value, a customer counts as “active” if they ordered in the last 90 days, revenue is recognized when the item ships and not when the card is charged.
That last group is where most of the value hides. Anyone can reconstruct the first two from a schema. The rules live in people’s heads, in a Slack thread from March, and in the WHERE clause of a dashboard that one analyst built and everyone quietly trusts.
Here is the difference that matters. A schema tells you orders.customer_id joins to customers.id. It does not tell you that half the rows in customers are guest checkouts that the business does not count as customers at all. An ontology carries that second sentence.
Why the graph shape wins
You could write all of this as a document. Plenty of companies have, and it sits in Confluence collecting dust.
The reason a graph beats a flat list is traversal. When an agent lands on the node for “active customer,” it does not just get a definition. It gets the edges: which table this metric is computed from, which dashboard publishes it, who owns it, which other metrics depend on it, and which competing definition exists in the Finance domain.
That is a very different retrieval problem than searching a wiki. The agent does not need to guess which of 400 tables is relevant. It starts at the concept it was asked about and walks two or three hops. Everything it needs is adjacent, and everything irrelevant is simply not connected.
Think of a schema as a map showing every road in the city. An ontology is the same map with the roads people actually drive marked in bold, the closed ones crossed out, and a note on which route your colleagues take to work.
🕸️ Knowledge graph vs context graph
These two terms get thrown around as synonyms. They look identical if you draw them: nodes, edges, labels. The difference is not the shape, it is when the thing gets built and what question it answers.
A knowledge graph answers “what is generally true here?” You build it once, you maintain it over time, and it holds regardless of who is asking. Customer places Order. Revenue is recognized on ship date. Northeast region includes these six states. This is long-term memory. It is stable, it is shared, and it is worth investing in because it outlives any single question.
A context graph answers “what does this specific task need, right now?” It gets assembled on demand, it contains only the pieces relevant to the decision in front of you, and then it is thrown away. This is working memory. Small, disposable, and shaped entirely by the question.
The distinction sounds academic until you think about token budgets. You cannot hand an agent your entire knowledge graph. A real enterprise graph has hundreds of thousands of nodes, and stuffing it into a prompt puts you right back at the two million token problem. But you also cannot skip the knowledge graph and assemble context from scratch every time, because then the agent is back to probing and guessing.
Genie Ontology sits on both sides of that line
This is the part I find genuinely clever about the design. Databricks maintains a persistent learned layer that keeps growing as your business generates queries, dashboards and pipelines. That is the knowledge graph half. Then, for each incoming question, it pulls a scoped subgraph containing just the concepts, metrics and tables that question touches. That is the context graph half.
The agent never sees the whole thing. It sees a distilled slice, cut to fit the question, with the irrelevant 99.9% left behind.
Databricks calls the whole mechanism a context layer, and that is the honest name for it. Not a semantic model, not a catalog, not a wiki. A layer that sits between everything your company knows and the narrow window an agent can actually read.
Nobody sits down and writes it
The part that surprised me most is how little of this you author. Databricks splits the ontology into modeled context, the things you define and certify on purpose through metric views, domains and Pages, and inferred context, which Genie extracts and maintains on its own from assets you already have: metric views, dashboards, SQL queries and other Genie Agents.
The unit it works in is a snippet. Not a table, not a whole document, but a single piece of business knowledge small enough to state in a sentence. The docs group them into three kinds, and the examples are worth reading closely because they are exactly the things that normally live in somebody’s head:
- Metric definitions. “An active user is a distinct user, deduplicated across all platforms.”
- Authoritative sources. “Revenue questions should be answered using the curated Finance Genie Agent.”
- Business rules. “A qualified lead only counts once a demo is booked.”
Every snippet carries an authority score derived from where it was generated, how often it gets used, and how fresh it is. At query time Genie ranks the relevant snippets, resolves the conflicts between them, and answers using only the ones your Unity Catalog permissions let you see. When it does, the answer comes back with citation icons pointing at the snippets behind it.
Read that list of inputs again, because it has a consequence people miss. Dashboards and query history are inputs. That means the ontology is being assembled out of the artifacts your team produces anyway, whether or not anyone intends them as documentation.
That is why I keep calling it the new context graph of the enterprise. Every company already has this knowledge. It is just scattered across 40 tools and nobody has ever assembled it into something a machine can walk.
🔍 The example: “How many active customers did we have last month?”
Small on purpose. Three tables, two dashboards, one disagreement. Everything that goes wrong at 400 tables already goes wrong at three.
The setup
| Asset | What it is |
|---|---|
main.sales.orders | Fact table, 40M rows, certified in Unity Catalog |
main.sales.customers | Dimension, includes guest checkouts as rows |
main.marketing.customer_360 | Somebody’s derived table, last refreshed 8 months ago |
| Exec Weekly dashboard | Built by the Head of Analytics. Opened ~400 times a week. Defines active as ordered in the last 90 days, guests excluded |
| Growth Experiments dashboard | Built by a growth analyst for one test. Opened 3 times, never since. Defines active as ordered in the last 30 days, guests included |
Two definitions of the same word, both live in production, both technically defensible. This is not a contrived scenario. This is Tuesday.
Step 1: extraction
Genie Ontology reads what already exists. Table schemas and column comments, the SQL behind both dashboards, query history showing who runs what and how often, pipeline lineage showing customer_360 has not been written to since December, and Unity Catalog certification flags.
Nobody wrote a spec. The knowledge was already sitting in the queries people run.
Step 2: the graph
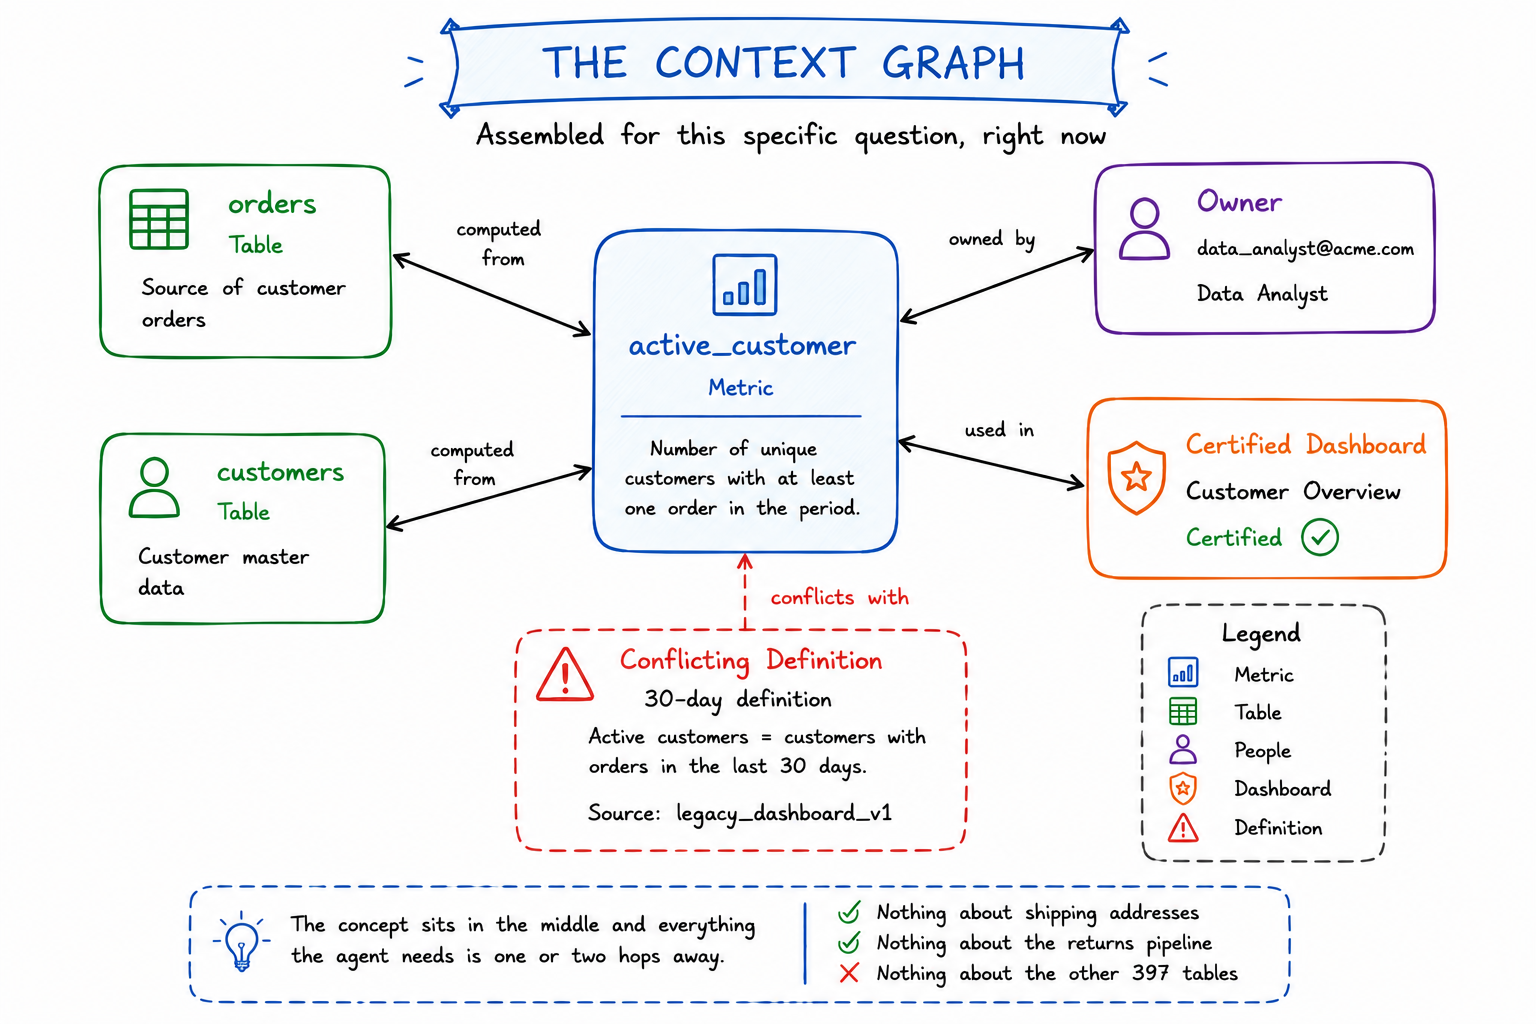
The point is not that the picture is pretty. The point is that the concept sits in the middle and everything the agent needs is one or two hops away. Nothing about shipping addresses, nothing about the returns pipeline, nothing about the other 397 tables.
Step 3: node summarization, the part that does the real work
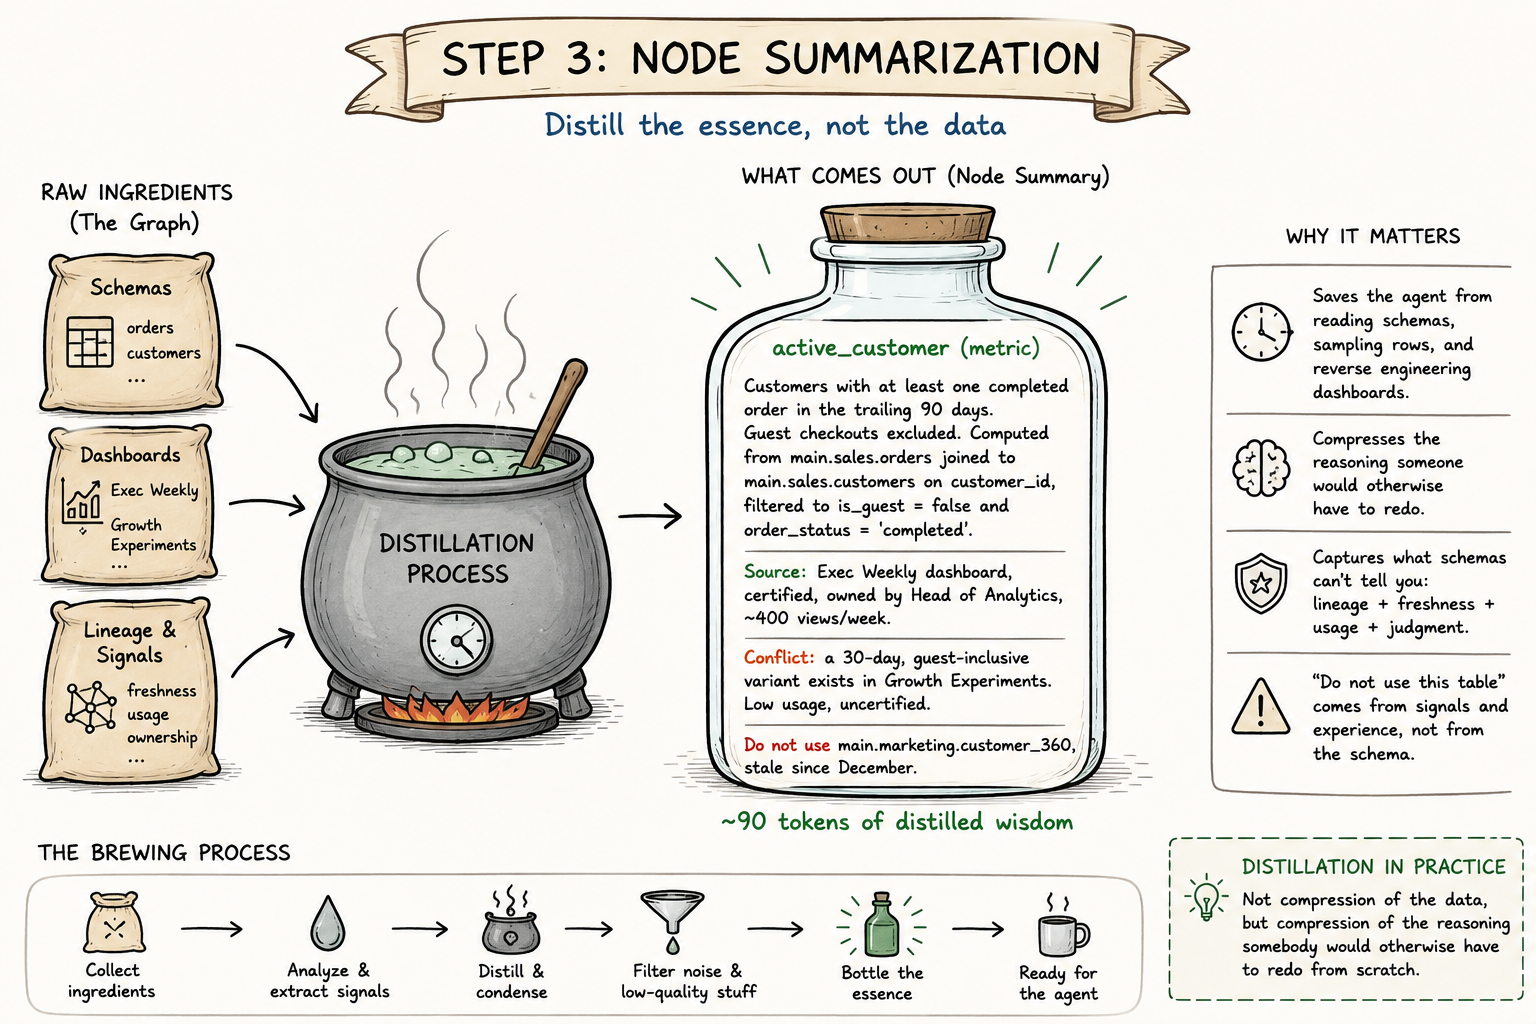
An agent does not read the raw graph. It reads the summary attached to each node. For active_customer that is roughly:
active_customer (metric)
Customers with at least one completed order in the trailing 90 days. Guest checkouts excluded. Computed from
main.sales.ordersjoined tomain.sales.customersoncustomer_id, filtered tois_guest = falseandorder_status = 'completed'.Source: Exec Weekly dashboard, certified, owned by Head of Analytics, ~400 views/week.
Conflict: a 30-day, guest-inclusive variant exists in Growth Experiments. Low usage, uncertified.
Do not use
main.marketing.customer_360, stale since December.
That is about 90 tokens. It replaces reading three schemas, sampling rows, and reverse engineering two dashboards. That is what distillation means in practice: not compression of the data, but compression of the reasoning somebody would otherwise have to redo from scratch.
Note the last line especially. “Do not use this table” is not something a schema can tell you. It comes from lineage plus freshness plus the fact that nobody queries it anymore.
Step 4: two agents, same question
Agent without the ontology:
- List catalogs and schemas
- Describe
customers,orders,customer_360 - Sample rows from each
- Notice
customer_360has a convenientis_activecolumn, use it - Return a number computed from December data
- Nobody catches it because the number looks plausible
Agent with the ontology:
- Resolve “active customers” to the
active_customernode - Read the summary
- Write one query using the certified definition
- Return the number, plus a note that a 30-day variant exists if that is what you meant
The first path is six steps and a wrong answer. The second is one hop and a correct one, with the ambiguity surfaced instead of silently resolved.
What actually changed
Same model. Same tables. Same question. The only difference is that in the second run the agent started from distilled context instead of building it from raw material under time pressure.
That is the whole argument for ontologies, and it is worth saying plainly: you are not making the agent smarter. You are removing the part of the job it is worst at.
⚖️ Who wins when two definitions disagree
Back to our two dashboards. Both define “active customer.” One says 90 days without guests, the other says 30 days with guests. The agent has to pick one. How?
Databricks built an engine for this and named it OntoRank. The comparison they used on stage was PageRank, and it is a fair one. PageRank did not judge whether a web page was true. It judged how much the rest of the web behaved as if it were. OntoRank does the same thing to definitions.
The signals it weighs:
- Where the definition came from. A certified asset in Unity Catalog outranks an ad hoc query someone ran once.
- Who authored it. The Head of Analytics carries more weight than a contractor who left in March.
- How much people rely on it. 400 views a week versus 3.
- How tightly it connects to other trusted things. A definition that certified dashboards depend on inherits some of their standing.
- How fresh it is. Something last touched in December is treated as suspect, which is exactly what saved us from
customer_360in the last section.
Run our example through that and it is not close. Exec Weekly wins on every signal. The 90-day, guest-excluded definition becomes the one Genie answers from, and the 30-day variant gets kept as a noted alternative rather than deleted.
Permissions come along for the ride
One detail that is easy to skip past and shouldn’t be. OntoRank only ranks what you personally have access to. If the Finance domain has a stricter revenue definition and you cannot read the Finance tables, that definition does not silently leak into your answer through the ontology. The graph is filtered per user before ranking happens.
This is the difference between a semantic layer bolted on top and one built inside the governance system. You do not end up maintaining a second, parallel permission model that drifts from the real one.
Now the honest part
Ranked does not mean correct.
If Finance and Sales genuinely disagree about what an active customer is, OntoRank does not resolve that disagreement. It picks a winner. Those are different things. What you get is a popularity contest with a forced tiebreaker, and it is entirely possible nobody in the room is happy with the outcome.
Worse, the losing definition does not go away. It keeps running on the Growth dashboard, and now you have two numbers in circulation plus an agent confidently quoting one of them.
Transparency is partly handled and partly not. Answers come back with citations pointing at the snippets Genie used, so you can at least see which definition you got. What is less clear is whether you see the road not taken: the competing definition that lost, and the reason it lost. Knowing your answer came from Exec Weekly is useful. Knowing that Growth Experiments would have given you a different number is what stops the meeting where two people quote the same metric and disagree. Until that is surfaced by default, treat the ranking as a strong prior and not a verdict.
The takeaway is simple enough. OntoRank is very good at finding the definition your company acts as if it believes. It cannot tell you whether your company should believe it. That part is still a meeting.
🚀 Why this changes how agents perform
Everything above was about correctness. The cost side matters just as much, and it is easier to overlook.
Fewer round trips
Go back to the two agent paths. The first one made six tool calls. Each of those is a network hop, a model invocation, and a chunk of tokens added to a context window that keeps growing. By step five that agent is reasoning over a prompt full of schema dumps and sample rows, most of which turned out to be irrelevant.
The second agent made one hop. Its context stayed small, which means every subsequent token it generated was conditioned on signal rather than noise.
This is the underrated part of context distillation. It is not just that the agent finds the right answer faster. It is that the agent stays in a state where it can reason well, because you never let its working memory fill up with material it has to filter.
The numbers Databricks published
On a 28 question suite of real-world data analysis tasks, Databricks reported that Genie answered 84.5% correctly on the first attempt. The strongest general purpose coding agent they tested managed 52.4%, and the weakest 25%. They also reported roughly 2x lower latency than the strongest competitor.
Two caveats worth stating clearly. This is a vendor benchmark on a vendor-designed question set, with competitors anonymized. And 28 questions is small. So treat the exact numbers as directional rather than settled.
That said, the shape of the result is what you would predict from first principles. An agent that starts with the right context beats an agent that has to derive it, and it should be faster too, because deriving context is most of the work. The benchmark is consistent with the mechanism. That is different from proving it, but it is not nothing.
The pattern outlives the product
Here is what I would take away even if you never touch Databricks.
The thing doing the work in this design is not proprietary. It is: build a persistent graph of your business concepts, attach a short natural language summary to each node, resolve the user’s question to a starting node, and hand the agent a two hop subgraph instead of your whole catalog.
You can build that on Neo4j and a vector index. Teams have been doing versions of it for years with OWL and RDF and SPARQL. What Databricks changed is who has to build it. The inference half runs off telemetry you were already generating, and the governance half was already in Unity Catalog. That lowers the cost of entry from “hire a semantic architect and budget two quarters” to “keep your catalog clean.”
The lesson generalizes: when an agent underperforms on your data, the first question should not be which model to swap in. It should be what a good analyst knows that the agent does not, and whether you can write that down as a graph.
🛠️ What you can do today
One thing to be upfront about: as of now you probably cannot use Genie Ontology. It was announced at Data + AI Summit in June 2026 and turned on for a small set of companies in a gated preview. General availability has not been dated, though the expectation is later this year.
That gap is not dead time. It is the best prep window you are going to get, because almost everything that makes the ontology good is work you do outside of it.
The half that gets inferred, and the half you author
As covered earlier, Genie Ontology is fed from two directions, and only one of them is yours to touch.
The inferred half builds itself. In Genie One the context graph is assembled automatically, pulled from your tables, queries, dashboards, pipelines and connected apps without anyone filing a ticket for it. You do not build that. You feed it, and you feed it whether you mean to or not.
The modeled half is the part you author deliberately, and this is where the real leverage sits. It means doing the unglamorous work first: reducing your dimensional model until it is honest, then making metric views the single central place a definition is allowed to live. Not a WHERE clause copied into eleven dashboards. Not a CASE statement somebody pasted into a notebook in 2024. One governed object, one owner, one definition, and everything downstream pointing at it.
Do that and you have handed the ontology a fixed point. The inference engine stops having to guess which of your four revenue calculations the company actually believes, because there is only one, and it is certified. Every hour you spend collapsing duplicate definitions into a metric view is an hour the ranking engine does not have to spend adjudicating them on your behalf.
Glossary and domains round out the same half. All of it exists today, independent of Genie Ontology, and all of it is useful on its own merits. If metric views are new to you, or you just want to refresh your memory on what they buy you, I walked through them with a worked example here.
So the inferred half is locked behind a preview, but the authored half is wide open right now. That is where to spend the window.
Engineering work
- Consolidation first. The context layer only learns from what it can reach. If half your business lives in systems Databricks cannot see, Genie can only answer half the questions, and people quickly learn to stop asking. This item dwarfs the rest of the list and it is the least exciting one on it.
- Dimensional modeling. Facts, conformed dimensions, honest grain. The graph is inferred from your model, so a confused model produces a confused graph.
- Metric views. Take your top KPIs and express them as governed objects instead of copy-pasted WHERE clauses.
- Asset hygiene. This one deserves emphasis. OntoRank weighs usage, freshness, and ties to certified assets. That means your abandoned dashboards and one-off exploratory queries are training signals. Every dead dashboard you leave running is a vote for whatever definition it contains. Retire what is dead, certify what is good.
- Permissions and lineage. The ontology is permission-aware, so your ACLs directly shape what agents can reason over. Sloppy grants become sloppy answers.
- An eval set. Write 20 questions you know the correct answer to. You will want them the day access opens.
The work that is not technical
- One definition of “active customer” that Finance and Sales both sign off on.
- A glossary with named owners and a review cadence, so definitions do not quietly rot.
- Domains drawn around how the business actually divides itself, which is rarely the org chart.
- Someone with the authority to settle a definitional dispute, and a norm that they do it before an algorithm does it for them.
If I had to compress the whole list: the business decides what a word means, engineering enforces it in the model. Get that handoff right and the ontology has something real to learn from. Get it wrong and you have automated the confusion.
If you want to build one now
There is also a way to get hands on with the graph itself while you wait. OntoBricks is a Databricks Labs project that turns Unity Catalog tables into a materialized knowledge graph. You design an ontology in OWL, map it to your tables, materialize the triples, and query the result through a generated GraphQL API, with the ontology tooling exposed over MCP so agents can use it directly.
Be clear about what it is, though. It is not Genie Ontology, and it is not a shortcut into the preview. It is a Labs project, shipped AS-IS with no support agreement, and it asks you to author the ontology rather than inferring one from your telemetry.
🏁 Wrapping up
The through line of this whole post is one idea: agents do not fail because they lack intelligence, they fail because they are handed raw material and asked to reconstruct, under time pressure, what your team already knows.
Genie Ontology is Databricks’ answer to that. A persistent graph built from the queries, dashboards and pipelines you are already generating, summarized node by node, sliced down to a scoped subgraph per question, ranked by authority, and filtered by permissions. Not a bigger context window. A smaller, better one.
Three things worth carrying out of here:
- Distillation beats retrieval. A 90 token node summary that encodes what a good analyst knows will outperform 50,000 tokens of schema every time.
- The graph learns from your mess. Dead dashboards and stale tables are training signals, not neutral clutter. Clean them before they get a vote.
- The hard part was never the technology. Ranking definitions is solvable. Agreeing on them is a meeting, and no algorithm is going to hold it for you.
The companies that get value in month one will be the ones who already know what their own words mean. That work is available today and it pays off whether or not the product ships the way the keynote promised.
Your turn: what is the one metric in your company that has two definitions floating around, and which one would OntoRank pick? Drop it in the comments, I am curious how many of us have the same one.
📚 References
- Introducing Genie One, Genie Agents, and Genie Ontology, Databricks Blog, June 2026
- Databricks Genie Ontology Is Coming, Here’s How to Prepare Your Company, Hiflylabs, July 2026
- Chat with Genie One: Ontology, Databricks Documentation
- OntoBricks, Databricks Labs