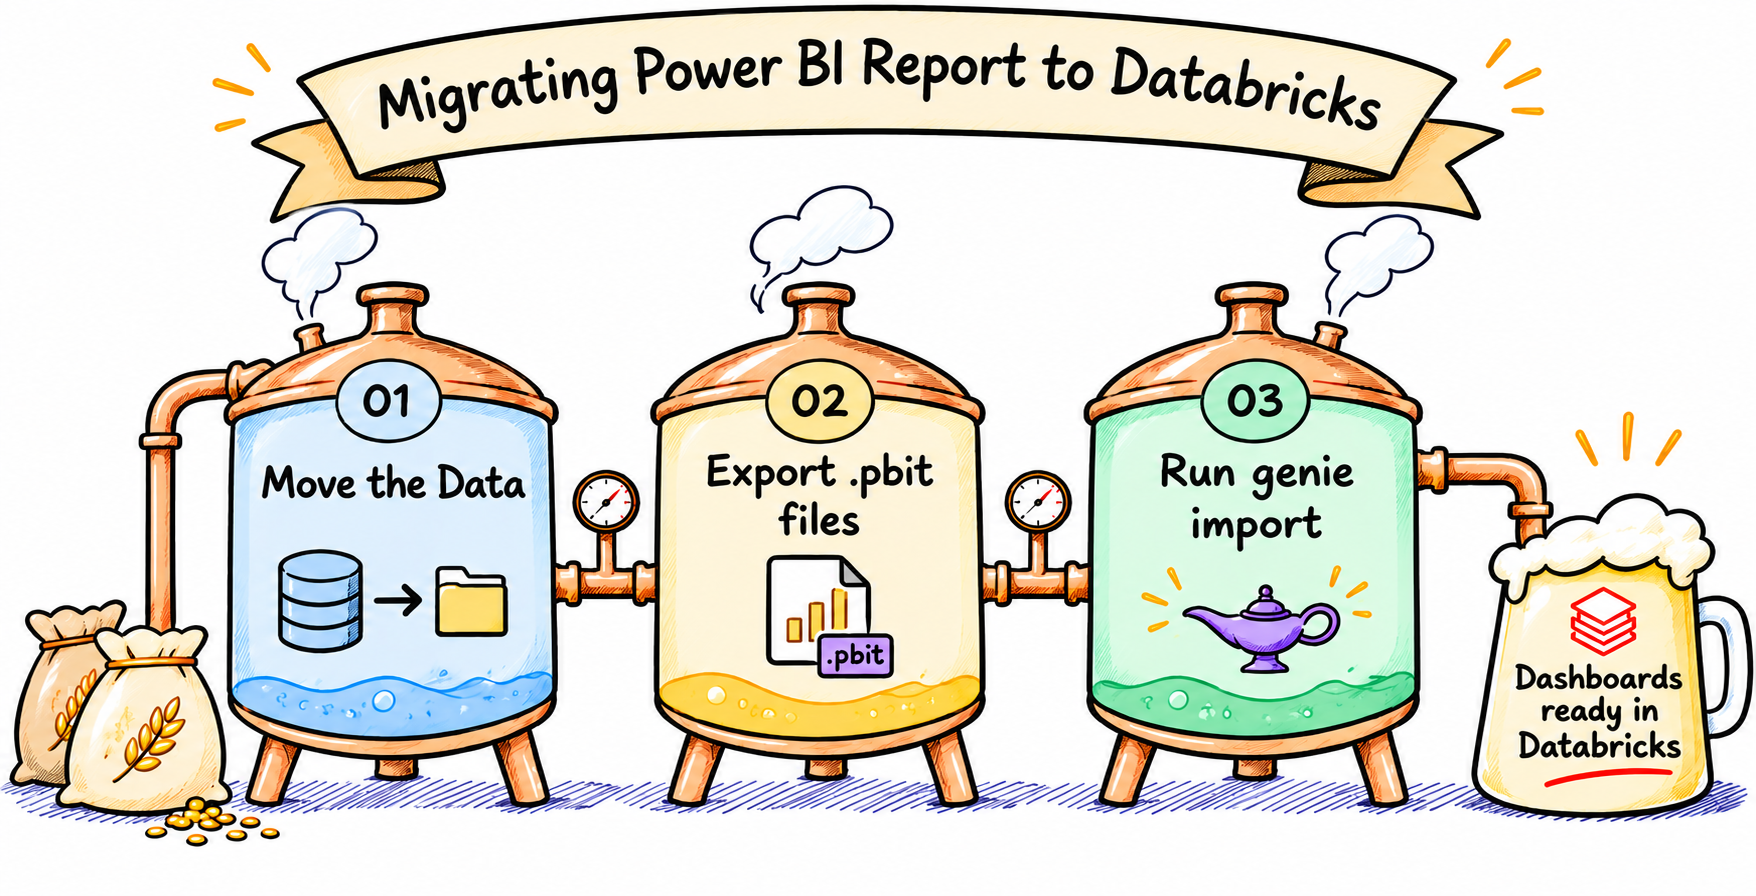
In many enterprises, getting access to data takes weeks. So teams built their own Power BI workspaces and did the transformations themselves in Power Query and DAX. It worked, but it left business logic and lookup data scattered across report files.
That setup is starting to look redundant. The data already lives in Databricks, the transformations run there, and the dashboards there can now do most of what Power BI does, often with less effort.
More and more teams are asking a simple question: why keep a second tool on top?
Databricks has also shipped a feature that makes leaving much easier: Genie Code can import a Power BI report and rebuild it as an AI/BI dashboard.
Why Power BI Is Becoming Redundant (IMHO)
Power BI made sense when the data platform was hard to reach and reporting needed its own home. Today, Databricks covers the whole path from raw data to the dashboard + AI/BI intefrace:
- The dashboards caught up. AI/BI now has cross-filtering, drill-through, maps, custom themes, and parameterized metrics. For most business reports, that’s everything people use.
- No second copy of the data. Dashboards query Unity Catalog tables directly. No extracts, no refresh schedules, no gateways.
- One set of permissions. Access is granted once in Unity Catalog and applies to tables, dashboards, and Genie alike.
- One definition of each metric. Measures live in metric views, shared by dashboards, Genie, and notebooks, instead of being copied into every report file.
- Questions in plain language. Any dashboard can be paired with Genie, so a manager can ask “why did revenue drop in March?” without waiting for a new report.
- No extra license. AI/BI dashboards and Genie come with Databricks SQL. You pay for the compute and Genie, not per user.
Power BI still has its strengths, like pixel-perfect design and very complex DAX model, but again all DAX queries now should be migrated to Databricks.
But for the everyday reports most enterprises run, keeping two tools means paying twice and governing twice.
The Overlooked Feature in Databricks - At least bad marketing job around this feature
In Databricks, go to Dashboards → Create → Import from Power BI and attach a Power BI template (.pbit). Genie Code reads it and:
- rebuilds the visuals as an AI/BI dashboard
- turns your DAX measures into metric views
- recreates the relationships between tables
Or you can just open Genie code and dump .pbit file and start importing BI report.

What used to be weeks of rebuilding by hand starts with a file upload.
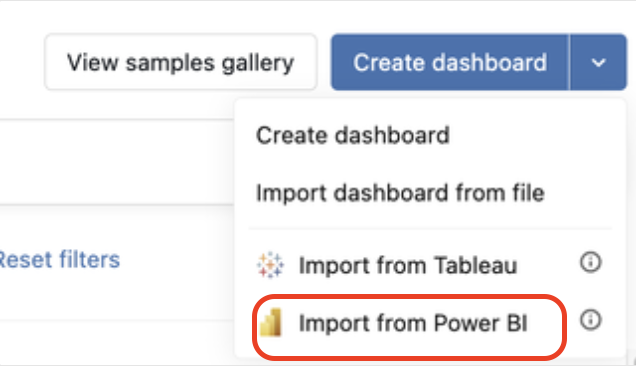
The Trick: Data Foundation First
A .pbit file carries the visuals, the data model, and the queries, but no data. Genie Code builds on tables in Unity Catalog. If your report’s data only lives inside Power BI, there’s nothing for it to build on.
Think of it like moving house. Genie Code moves the furniture, but the new house needs a foundation first.
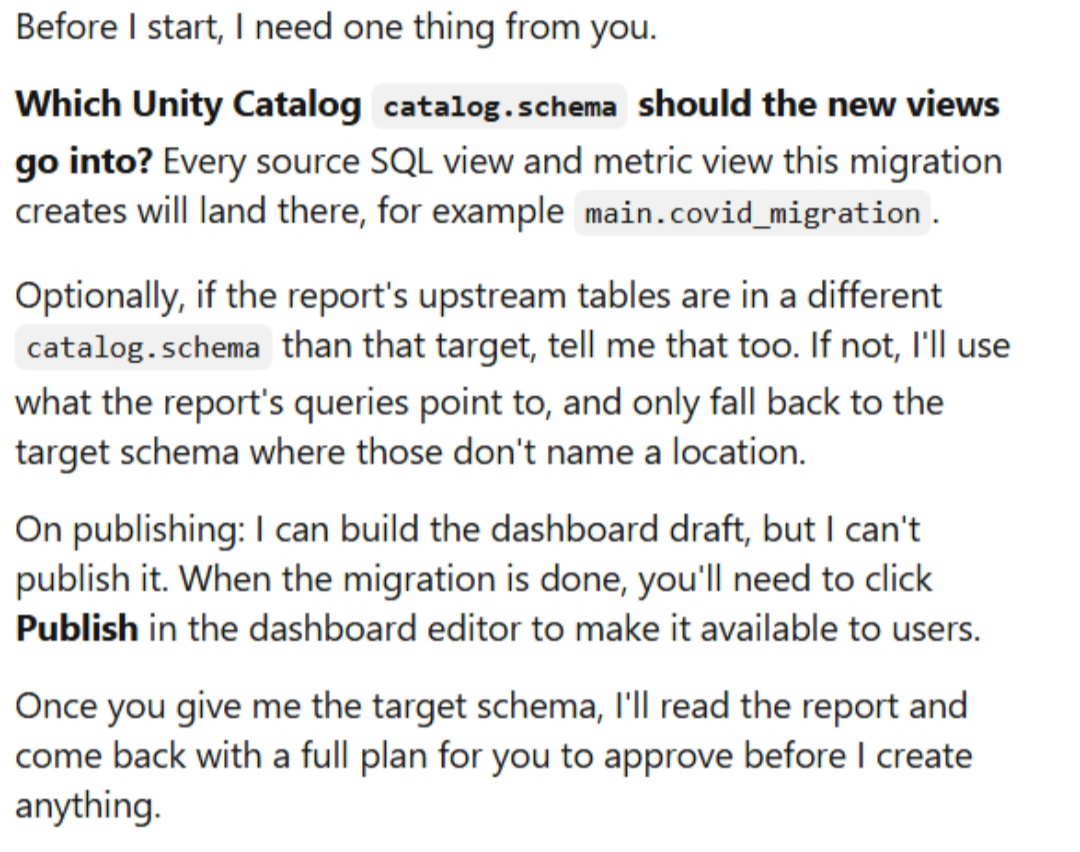
I tested this with Microsoft’s COVID-19 US sample report. When I opened the file, I found a perfect example of Power BI used as an ETL tool: it downloads over 1,000 daily CSV files from GitHub, keeps a 3,142-row county list typed directly into the report, and calculates daily cases with DAX row by row.
So before importing, I moved those three tables into Unity Catalog. After that, Genie Code asked only one question: which catalog and schema to use.
The Import in Practice
- Load the data the report uses into Unity Catalog tables.
- Upload the
.pbitplus a screenshot of the original report. The screenshot helps Genie Code check layout and numbers. - Answer its questions, mainly where the source tables live.
- Review the result and correct anything that looks off, like you would with a colleague.
- Promote the metric views to Unity Catalog so dashboards, Genie, and notebooks share one definition of each measure.
What to Keep in Mind
- The feature is in Public Preview and needs partner-powered AI features enabled by an admin.
- Simple reports migrate cleanly. Complex DAX, custom visuals, and pixel-perfect styling still need a human touch.
- Always check the numbers against the original report before you switch anyone over.
Summary
For most enterprise reporting, Power BI on top of Databricks is now a second tool doing a job the platform already does.
The Power BI import is what makes walking away realistic, and it’s one of the least known features Databricks has added this year.
The import takes minutes. The real work is the data foundation: once your data lives in Unity Catalog, moving the reports on top becomes the easy part.
If you want to see how those migrated measures work under the hood, read my post on Unity Catalog Metric Views next.